London, May 2025
State Of Our Trails Report


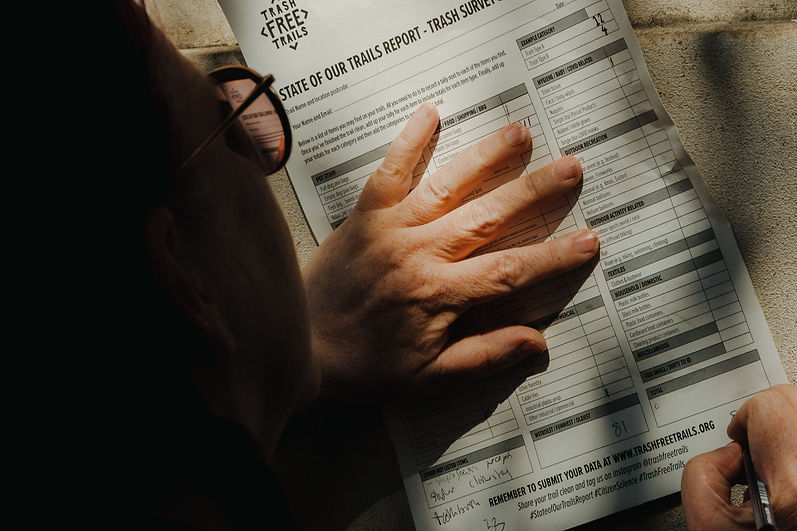
Over the last six years 7,000+ people have removed, recorded and reported over half a million items of single-use pollution from places they love.
How do we turn their donation into meaningful action?
The State of Our Trails Report brings together the findings of our volunteers into a one-of-a-kind annual Report on the state of single-use pollution on recreational trail ecosystems in the UK.
We are studying the prevalence, composition and impacts of single-use pollution - or what you know as litter - on recreational trails.
This Report is not merely a collection of data, but a reflection of the thousands of people who make up our community, and their commitment to protect the wild places they love.
There is no other Report like this in the world.
��Latest Report published November 2025
Since 2019 the Trash Free Trails Community Has
Removed and Surveyed
550,826 items
Covering
14,193 km
Achieved by
7,018 Volunteers
Donating
11,515 hours
88% of items found were
single-use
77% of volunteers felt more
connected to nature after trail cleaning
How much is all this trash actually worth?
Extended Producer Responsibility Special Edition
November 2025
For years, the big corporations driving this waste have been allowed to deliberately pass the buck. The financial burden has landed on the shoulders of tax payers and the true price has been paid by our environment.
Finally, a new policy in the UK is flipping that script, placing accountability and the cost of packaging waste where it belongs: with those who profit from it.
Under Packaging Extended Producer Responsibility (pEPR), any business putting packaging out into the UK market must track it, report it, and pay for its entire journey; from production, to the shelves, to recycling.
Unfortunately for our trails, pEPR isn't going anywhere near them.
40% of what our volunteers find is made from materials covered by the Scheme, but the funds raised are currently not intended for tackling 'bin and ground litter'.
Additionally, the fees raised are only allocated to Local Authorities - there's no money available for land managers, National Park authorities, NGOs, community groups and individual volunteers.
Our trails are cut out of the funding loop.
In our 2025 Special Edition we have, for the first time, used our data to put a price tag on EPR-eligible single-use pollution. We are giving voice to our trails, and asking DEFRA, PackUK and packaging producers to do the same.
These places are invaluable - funding to protect them can't wait.


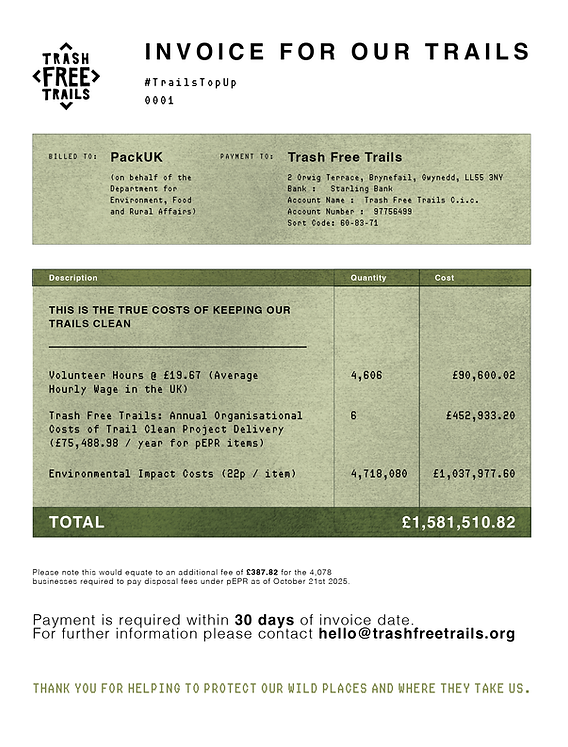
Hours Spent Removing, Reporting & Recording pEPR items by Volunteers

Cost of environmental damage inflicted on trail ecosystems by pEPR items, reducing their ‘serviceable value’ trails

6 years of Administration, Resources, Overheads & Wages paid by Trash Free Trails for delivering Trail Clean projects and activities for pEPR items
We sent this invoice to DEFRA on November 13th 2025.
Packaging Pollution: Analysis

Based on our data, there are potentially up to 4.7 million pEPR eligible items of single-use pollution on UK Public Rights of Way (PRoW), right now.
This excludes drinks containers eligible for the forthcoming UK Deposit Return Scheme (DRS) which we focused on in our 2024 Report.
For this Report we have analysed our single-use pollution data through the lens of pEPR material types.
While some of the designated pEPR materials are less common in our trail cleans, others are persistent, showing up in almost every Survey our volunteers report.

WHAT DO YOU THINK THESE PLACES, WHICH MEAN SO MUCH TO US, ARE WORTH?
The Service of Trails
There is widespread understanding that time spent in wild places has significant emotional, physical and social benefits.
Despite this, we are living in an unprecedented time of biodiversity and green space loss in the UK.
We feel the benefits of our trails as individuals, but to champion them through policy we need to speak in the same terms as schemes like pEPR - to determine their economic, cultural and environmental value.
We've captured here some examples of the 'services' trails offer - not just to us and our communities emotionally and socially, but through environmental and economic means - and the impact single-use pollution can have on them.

Clean Water


Soil Formation
& Carbon Sequestration


Recreation & Tourism


Biodiversity
What services do you think trails provide?

Owning Your Sh*t: Brand Analysis

Through Extended Producer Responsibility (pEPR), we're getting ever closer to realising our vision of Shared Responsibility.
Consumers, government and producers of packaging must take on their fair share of responsibility for single-use pollution. For too long the buck has been passed and the blame placed solely on the 'litterer' - this policy changes that narrative for good.
We believe pEPR is as much a win for producers as it is for our trails - by being advocates for our Trails Top Up, they can capture the attention of conscious consumers, and position themselves as protectors of our wild places too.
With this in mind we sent a personal invoice to the 5 most prevalent pEPR eligible brands our volunteers find, so they can do their fair share for our trails.

What can I do now?
About Our Data
Through the State of Our Trails Research Programme we are committed to scientific accuracy and transparency. Sharing methods is a core principle of the scientific process; it’s also what will enable us to work together to achieve a Trash Free Future. We also believe everyone, everywhere, can produce robust data about single-use pollution on their trails.
here, we have provided the methods by which we calculated the three central ‘costs’ of pEPR pollution - to our trails, wild places and those who rely upon them - in our 2025 State of Our Trails Report.
If you'd like to speak to us about our research, email heather@trashfreetrails.org
pEPR lens - Part 1
To obtain the quantity of pEPR items of different materials and types present on our trails we used our detailed Composition data. We have 1170 individual Trash Surveys which provide a complete breakdown of 97,657 items of SUP. By selecting Composition categories with relevant materials we find 40% of these items fall under pEPR legislation.
All our data streams combine to produce an average of 38.81 SUP items per km; 40% of this gives us 15.52 pEPR items per km of trail. With 220,000 kms of PRoW and 84,000 kms of foot and bridle-path in Scotland we can estimate 4.7 million pEPR items are currently on our trails.
PackUK breaks down pEPR fees per tonne of material. By breaking down our Trash Surveys into these material types (estimating average weight of the different items) and extrapolating these to the aforementioned 304,000 kms of trail we come to the £34,437.10 PackUK fee.
Environmental Impacts - Part 2
To estimate the ecological and social costs of single-use packaging (SUP) on UK trails, we adapted marine-plastic pollution valuation methods to terrestrial environments. Using Beaumont et al. (2019) as a baseline (£2,000 - £10,000 per tonne ≈ £0.04 - £0.40 per item in natural-capital loss), we applied ecological-sensitivity multipliers (×1.5 - 2 for peatland and alpine habitats) and public-use adjustments (×1.5 for heavily visited trails). These reflect both higher ecosystem-service density and the amplified visual and wellbeing impacts of pollution in popular landscapes.
We then integrated amenity losses using Defra’s (2013) willingness-to-pay estimates (£0.10 - £0.30 per item). Combined, this gives a total trail-ecosystem loss of approximately £0.10 - £0.60 per item per year (≈ £5,000 - £30,000 per tonne). Validation against UK Natural Capital Accounts and Defra’s ENCA toolkit confirms consistency with national evidence.
This transparent, conservative method recognises how SUP pollution erodes both ecosystem function and public enjoyment - providing a credible basis for including trail-ecosystem losses within Extended Producer Responsibility (EPR) frameworks.
Owning Y(our) Sh*t - Part 3
To calculate how many items of SUP there are for each brand out on our trails we again referred to our detailed composition data. 1170 individual Trash Surveys report the top 3 brands found on their trail clean. By extrapolating all the brands and attributing a score based on frequency of occurrence, we were able to estimate a percentage of each of the 157 brands observed on our trails.
These percentages can then be used to calculate a fair share of the different costs associated with SUP and its removal from our trails and wild places.


